CURRENT: Quick Overview
The Quick Overview report is an HTML report that provides a visual overview analysis for quantitative questions: You cannot directly export it like other reports, but you can highlight it and them copy/paste it into MS xcel, MS Word or Notepad. This report does not display qualitative (open text analysis) for My Comments or Open Text questions.
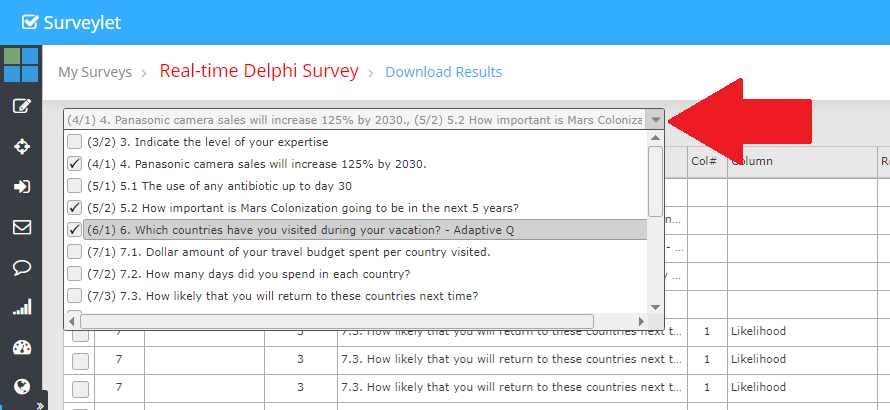
When this report selected, you will need to manually select one or more questions from the question selector dropdown to run this report for.
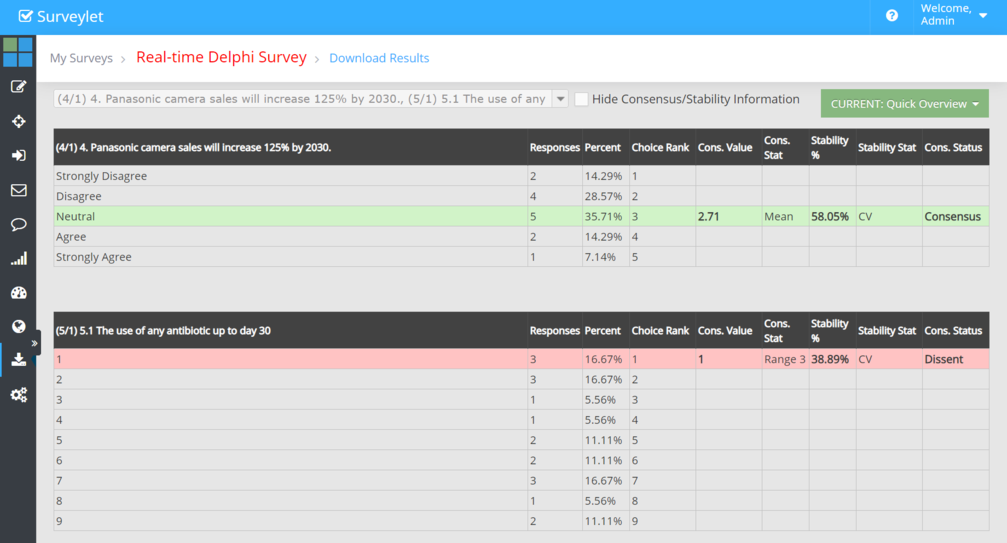
Let's run the report for a few quantitative questions. In the first example, the Neutral choice is highlighted with green background indicating that the Neutral choice is the choice of consensus and its stability value has reached the required stability threshold, hence a consensus is established.
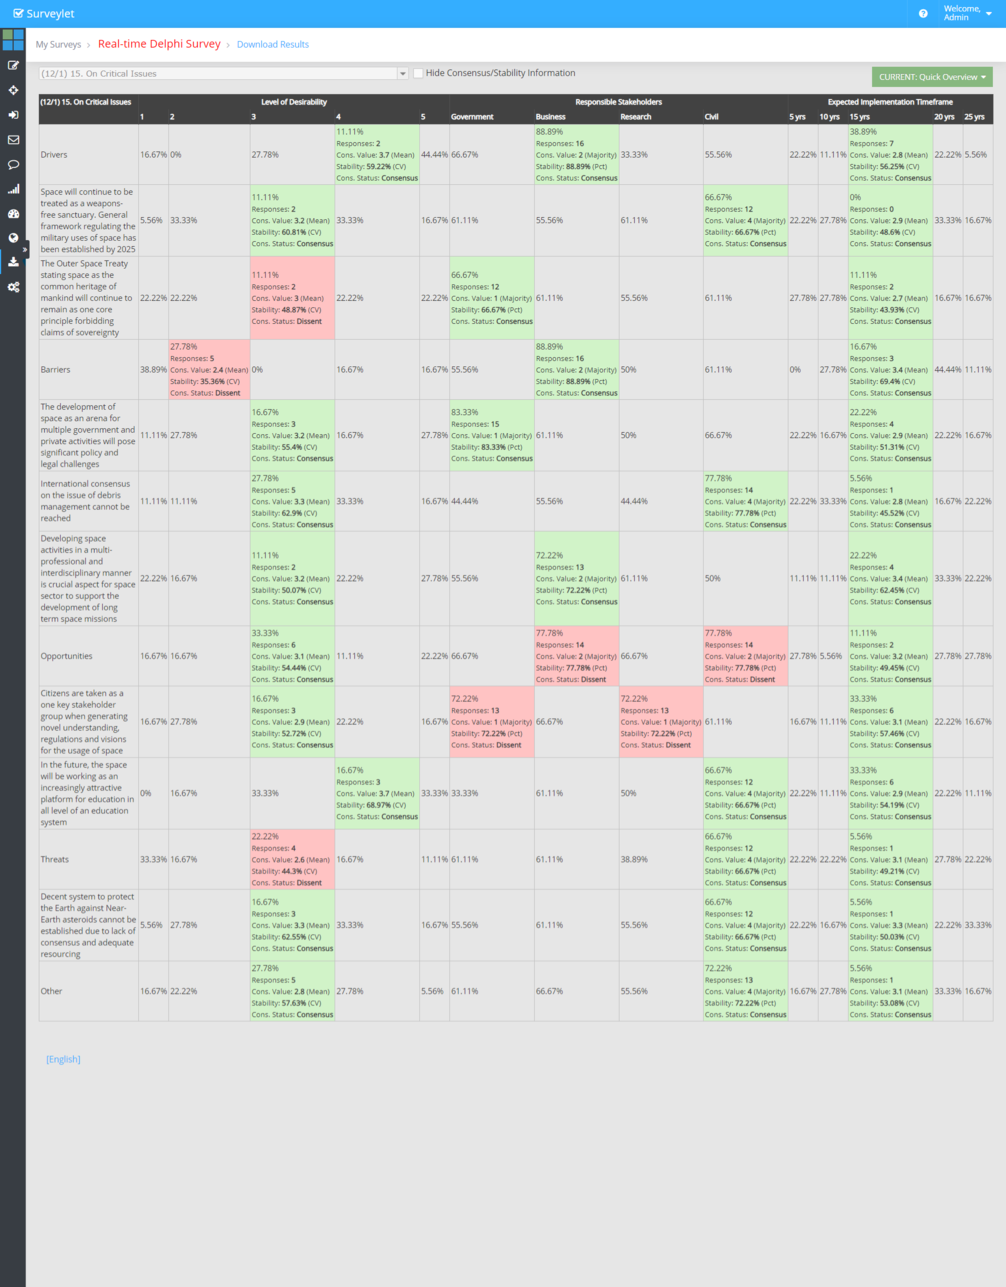
For matrix questions, the visualization makes it easy for administrators to identify cells with consensus or dissent, where consensus is indicated with a green, while dissent with a red background:
Question title:
The question title is prefixed with the page number and the question ranking position in this format (<page>/<question)ranking>) question_title. For example: "(4/1) 4. Panasonic camera sales will increase 125% by 2030."
Responses:
The number of responses the given choice received.
Percent:
The percentage of responses the given choice received.
Choice Rank:
Ranking position of choice in choice list.
Cons. Value:
Consensus score value.
Cons. Stat:
The statistical measure used to calculate Consensus.
Stability %:
Group Stability value (in percentage).
Stability Stat:
The statistical measure used to calculate Group Stability.
Cons. Status:
Status of consensus (Consensus/Disagreement).