Overview Tab
The Overview tab provides you with an overall analysis of the survey, consensus, stability and responses.
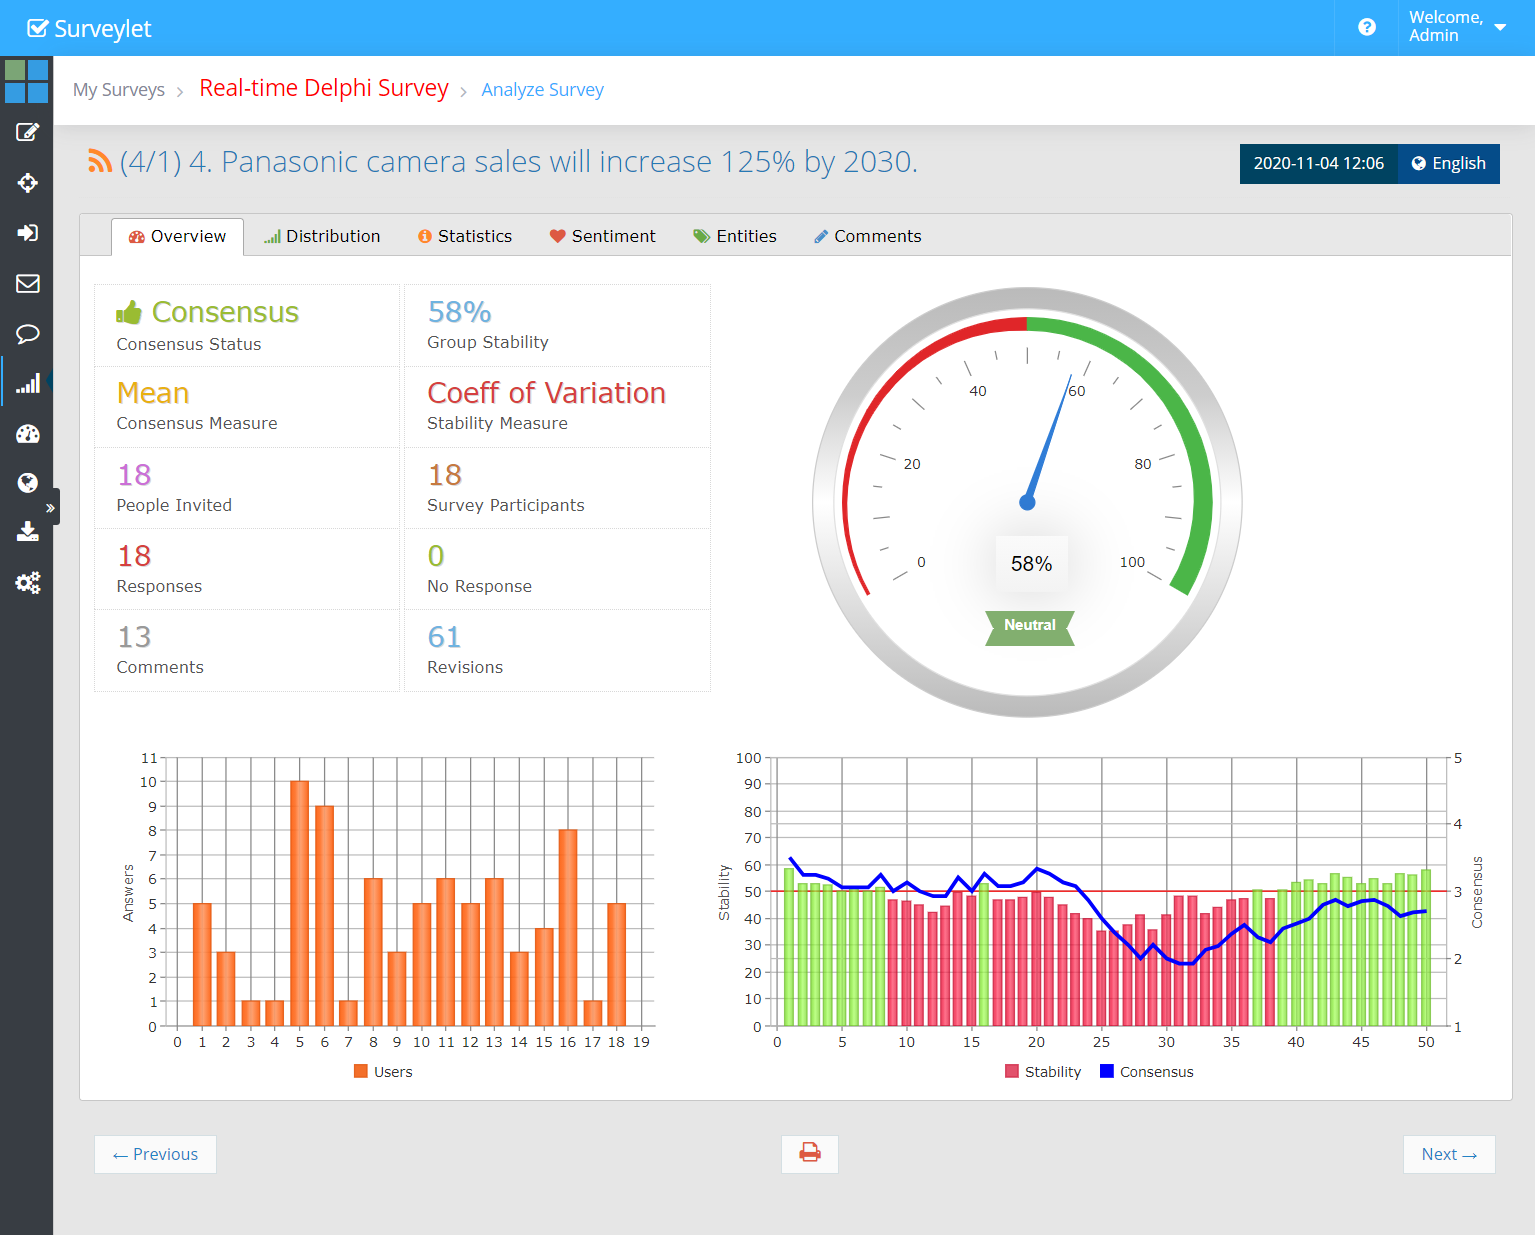
Consensus Status
The status of group agreement. Either Consensus or Disagreement.
Group Stability
Stability of Consensus (also known as Strength of Consensus)
Consensus Measure
The statistical measure used to calculate consensus.
Stability Measure
The statistical measure used to calculate Group Stability. Stability Measure settings is ignored for Range Consensus measure; "Range X" is displayed.
People Invited
The number of people invited to the survey. This is the number of people who are member of the survey participants group (i.e. the Surveylet Group your survey is assigned to).
Survey Participants
The number of panelists who clicked on your survey invitation link and entered the survey at least once.
Responses
The number of people who answered this question.
No Response
The number of people who have not yet answered this question.
Comments
The number of comments this question has received.
Revisions
The number of total revisions of answers/comments for this question.
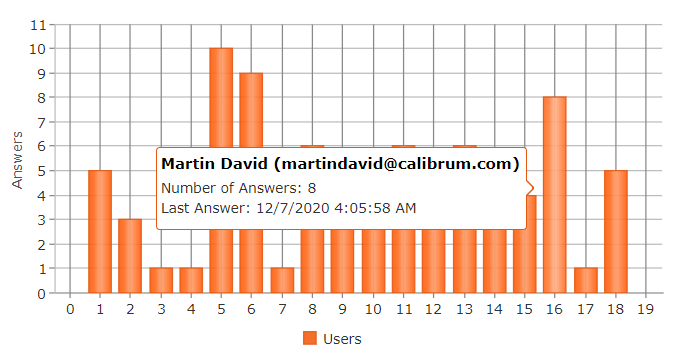
Respondent Chart
This vertical bar chart represents the responses and revisions made by panelists. Each bar is assigned to a panelists. The height of the bar indicates how many times the respondent answered/revised his/her answer to this question. If the Answer is 1, it means that the panelist answered the question only once and did not revise it afterwards. If for example the Answer is 10 (i.e. the height of the orange bar is at 10, it means that the panelist revised his/her opinion 9 times after s/he answered it). If you hover your mouse over a vertical bar, you will see response details, such as name (email), number of answers, and the date time of the last answer. If the survey's Privacy Settings is set to High, you as the administrator will not be able to see the name (email) of the panelist to hide identity.
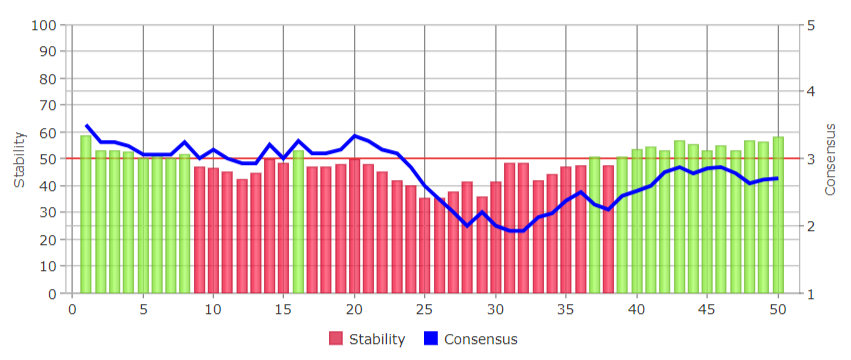
Consensus Chart
This historical chart displays the evolution of consensus. The blue line is the Consensus line graph (also known as line chart or running chart) displaying Consensus trend. Each green/red bar represents an event in time (either a new responses event, or a revision of existing response event). Events may not be of the same distance from each other in time as these events may happen randomly and not periodically. During a 2 week survey, maybe 80% of responses and revisions are submitted within the last few hours. The red horizontal line across the 50% mark represents the Stability Threshold.
The green vertical bars indicates the successful status of consensus at that time; the red vertical bars indicate that at that moment there were disagreement among panelists regarding this question. The 0 - 100 vertical coordinate on the left side is the Stability Status from 0% - 100%. The 1 - 5 values vertical coordinate represents the ranks of the 5 choices of that are assigned to this question (1 - Strongly Disagree, 2 - Disagree, 3 - Neutral, 4 - Agree, 5 - Strongly Agree). The chart display the 50 most recent events. The x coordinate at the bottom represents the number of events starting from 1 to 50.