Statistics Tab
Surveylet can collect data for 30+ statistical measures. Only statistics that are enabled on Survey Settings > Statistics tab are displayed on this page. You can visualize two statistical measures side by side in the same chart; one as a historical bar chart, the other one as a line chart. Click on the "Bar chart" or "Line Chart" dropdown boxes to select the statistics to display.
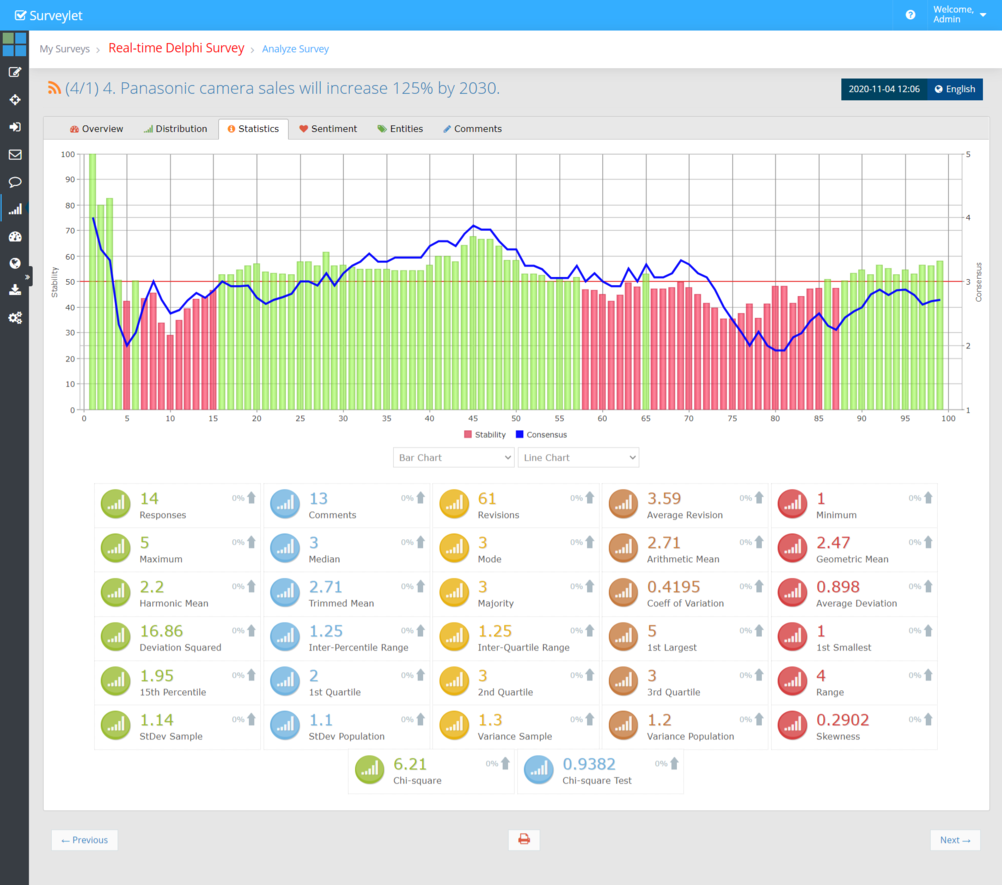
Statistics are collected when a response event to a question happens. A response is event is a new response, or a revision of an existing response. When an event occurs, a new event id is generated. Statistics that were enabled will be calculated and stored in the database under that event id and will be displayed on this page. You may enable statistics at any time, but values will only be created going forward and will not be created retrospectively backward in time.