View Demographics
The View Demographics page allows you to run cohort analysis for your questions or matrix cells. Select the question or matrix cell on the right side (shown by the red left-arrow below), and select the demographics question on the demographics dropdown button displayed in the upper right corner (shown by the red vertical down arrow below):
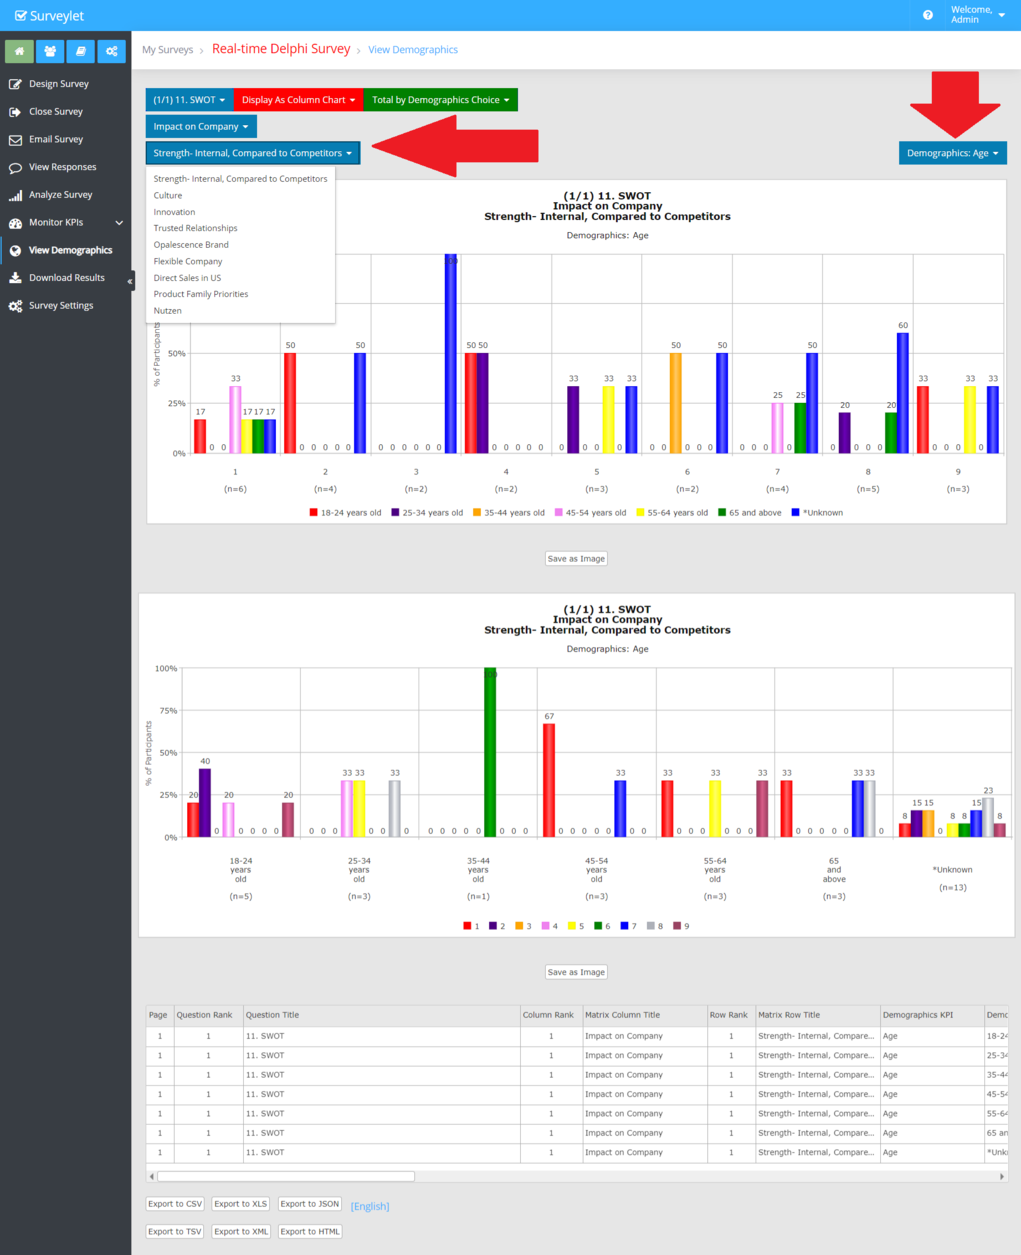
You may save the demographics analysis as an image also by clicking on the 'Save as Image" button under the graphical chart.
You may select different charts (as Column Chart or Stacked Column Chart) to be displayed; and also review and export the data in multiple file format.
You create the Demographics KPIs on the Library > KPI > Demographics Categories page. You may assign the same KPI to one or more questions. Do not assign the same Demographics KPI to multiple questions in the same survey. But you can assign any other custom KPIs to multiple questions in your survey.